Quant Analyzer Portfolio Report
Portfolio
Total Profit
$ 12561.31
Profit in pips
141838.4 pips
Yrly Avg profit
$ 919.14
Yrly Avg % ret
22.98 %
CAGR
10.68 %
# of trades
15883
Sharpe ratio
0.06
Profit factor
1.2
Return / DD ratio
15.38
Winning %
48.37 %
Drawdown
$ 816.7
% Drawdown
11.96 %
Daily Avg profit
$ 2.53
Mthly Avg profit
$ 76.59
Average trade
$ 8.56
Annual% / Max DD%
0.89
R Expectancy
0.1 R
R Exp score
113.47 R
SQN
7.75
SQN score
3.45

Strategies in portfolio
| # | Name | Symbol | Timeframe | Net Profit ($) | Net Profit (pips) | # of Trades | Sharpe Ratio | Profit Factor |
| S1 | A_GBPJPY1 | A_GBPJPY1 | unknown | $ 2656.13 | 29706.2 pips | 2333 | 0.07 | 1.25 |
| S2 | A_GBPJPY2 | A_GBPJPY2 | unknown | $ 3134.42 | 34837 pips | 1448 | 0.09 | 1.48 |
| S3 | A_GBPJPY3-3 | A_GBPJPY3-3 | unknown | $ 3557.97 | 39576.2 pips | 1583 | 0.09 | 1.5 |
| S4 | I_EURJPY | I_EURJPY | unknown | $ 3212.79 | 37719 pips | 10519 | 0.02 | 1.09 |
| # | Name | Return / DD Ratio | Winning % | Drawdown | % Drawdown | Yearly avg. profit | Monthly avg. profit | Daily avg. profit |
| S1 | A_GBPJPY1 | 10.32 | 41.37 % | $ 257.27 | 25.73 % | $ 194.41 | $ 16.2 | $ 0.63 |
| S2 | A_GBPJPY2 | 14.17 | 29.66 % | $ 221.19 | 17.79 % | $ 229.37 | $ 19.11 | $ 0.77 |
| S3 | A_GBPJPY3-3 | 16.9 | 24.88 % | $ 210.53 | 20.53 % | $ 260.27 | $ 21.69 | $ 0.84 |
| S4 | I_EURJPY | 6.16 | 56.12 % | $ 521.87 | 29.42 % | $ 235.08 | $ 19.59 | $ 0.65 |
Monthly Performance ($)
| Year | Jan | Feb | Mar | Apr | May | Jun | Jul | Aug | Sep | Oct | Nov | Dec | YTD |
| 2018 | 88.24 | 10.98 | -171.74 | 104.78 | 135.79 | 18.18 | 12.19 | 178.33 | 0 | 0 | 0 | 0 | 376.75 |
| 2017 | 270.67 | 16.64 | -209.2 | 390.38 | -83.1 | 218.25 | -146.01 | 15.79 | 179.45 | -31.86 | -0.76 | -48.89 | 571.36 |
| 2016 | 125.52 | 375.76 | -118.27 | 214.55 | -132.67 | 83.68 | 230.98 | 177.56 | 109.41 | 41.57 | 211.39 | -23.66 | 1295.82 |
| 2015 | -12.02 | -114.25 | -92.76 | 299.25 | -144.71 | 114.71 | -176 | 372.96 | 136.77 | -23.49 | 99.62 | 353.69 | 813.77 |
| 2014 | 10.97 | -66.98 | 83.81 | -68.34 | -77.6 | -65.46 | -133.8 | -128.14 | 277.14 | 610.81 | 137.86 | 240.21 | 820.48 |
| 2013 | 270.36 | 185.71 | -149.54 | 160.55 | -166.5 | -87.11 | -164.97 | 44.84 | 4.26 | -35.05 | 320.37 | 5.86 | 388.78 |
| 2012 | 59.88 | 238.41 | 56.01 | 62.49 | 231.1 | -69.79 | -114.43 | -165.23 | -30.37 | -42.54 | 222.69 | 13.82 | 462.04 |
| 2011 | 157.44 | 27.09 | 105.32 | 132.11 | 154.25 | -187.46 | 80.57 | 1.9 | 80.71 | 238.63 | 2.91 | -58.64 | 734.83 |
| 2010 | -147.1 | 567.83 | 474.48 | -36.26 | 163.72 | -219.75 | -286.86 | 144.81 | 64.76 | -11.28 | 25.1 | -22.15 | 717.3 |
| 2009 | -46.32 | -67.74 | 604.91 | 79.48 | -93.96 | -70.7 | 416.78 | -220.53 | 142.38 | 488.92 | 92.06 | 261.02 | 1586.3 |
| 2008 | 173.74 | 96.6 | -203.78 | 365.97 | 126.64 | 110.4 | -120.61 | 334.21 | 424.17 | 1420.13 | -34.22 | -58.13 | 2635.12 |
| 2007 | 83.13 | 575.32 | 11.04 | -72.06 | -126.24 | 229.17 | 141.75 | -236.61 | 87.62 | 107.43 | 4.43 | 506.1 | 1311.08 |
| 2006 | 315.49 | 210.22 | 41.04 | 35.98 | -58.72 | -212.76 | 161.92 | 111.83 | 114.42 | 31.45 | 18.39 | 164.58 | 933.84 |
| 2005 | -42.98 | -44.62 | -89.06 | -36.16 | -153.67 | 67.24 | 39.21 | 19.71 | -158.26 | 104.7 | 147.85 | 59.88 | -86.16 |
Stats
Strategy
| Wins/Losses Ratio | 0.94 | Payout Ratio (Avg Win/Loss) | 1.28 | Average # of Bars in Trade | 0 |
| AHPR | 0.01 | Z-Score | -55.12 | Z-Probability | 99.9 % |
| Expectancy | 0.79 | Deviation | $ 15.02 | Exposure | -999999999 % |
| Stagnation in Days | 547 | Stagnation in % | 11 % |
Trades
| # of Wins | 7137 | # of Losses | 7619 | # of Cancelled/Expired | 1127 | ||
| Gross Profit | $ 74292.46 | Gross Loss | $ -61731.15 | Average Win | $ 10.41 | Average Loss | $ -8.1 |
| Largest Win | $ 142.82 | Largest Loss | $ -50.16 | Max Consec Wins | 18 | Max Consec Losses | 25 |
| Avg Consec Wins | 3.29 | Avg Consec Loss | 4.03 | Avg # of Bars in Wins | 0 | Avg # of Bars in Losses | 0 |
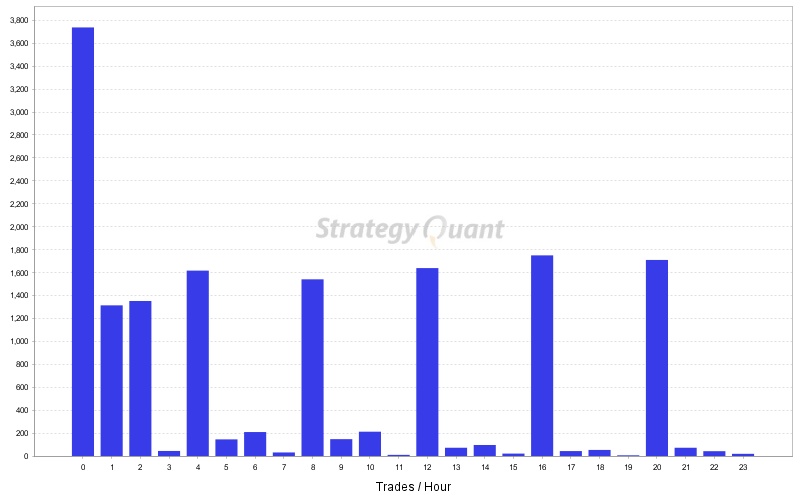
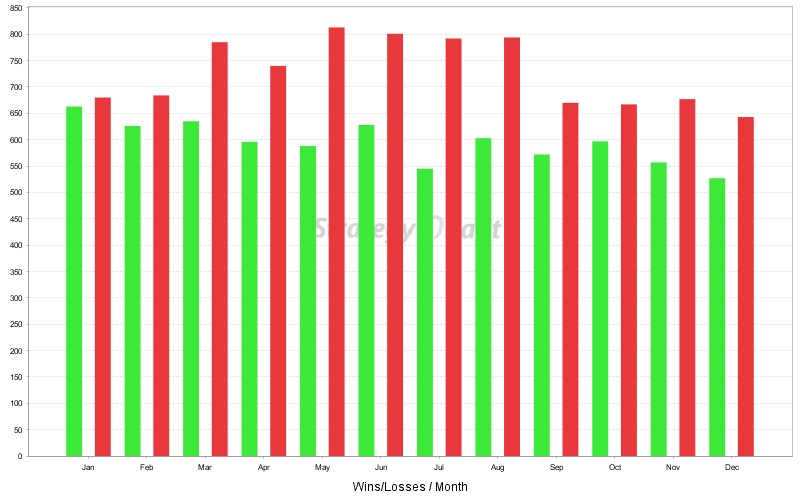
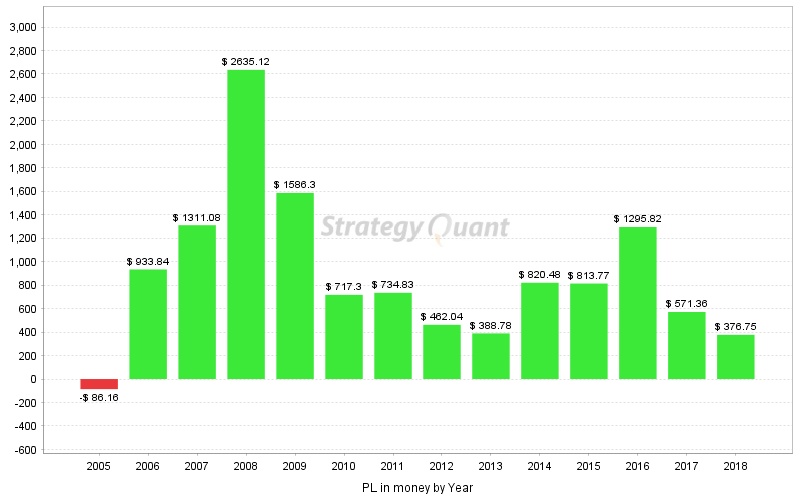
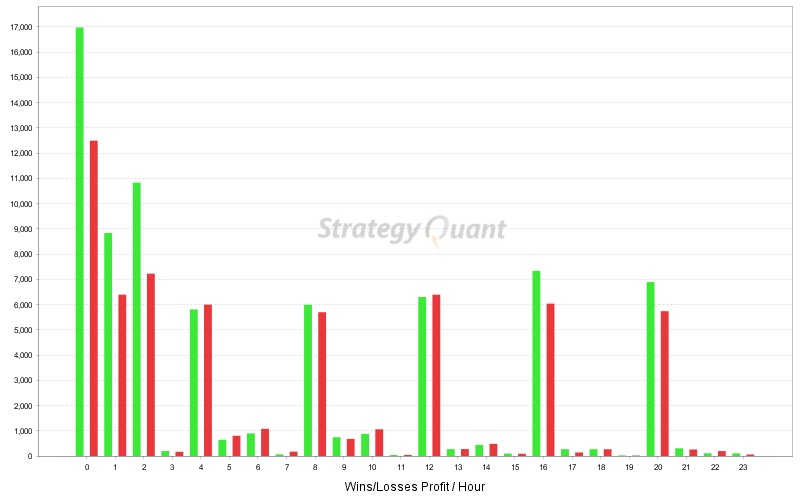
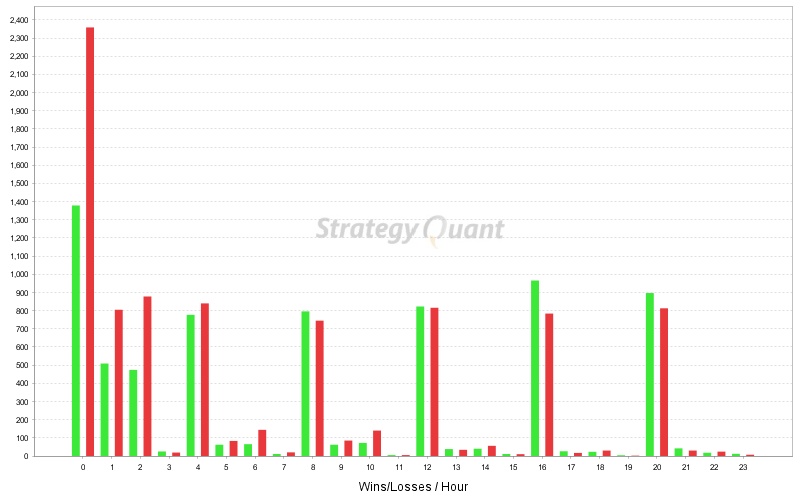
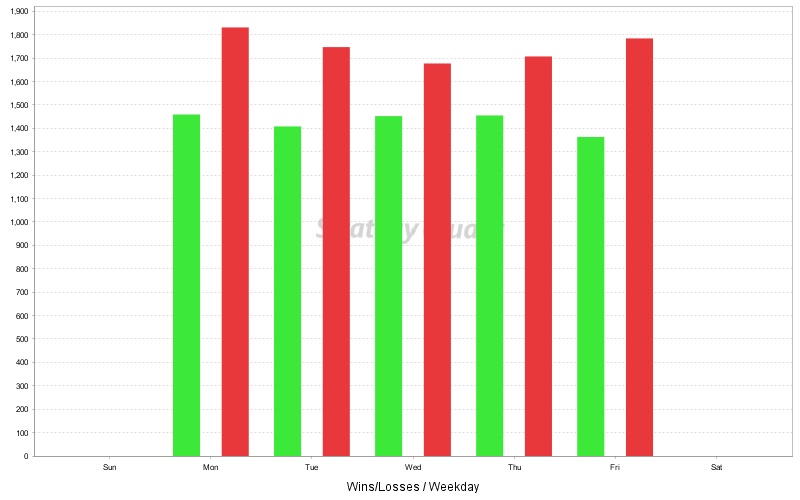
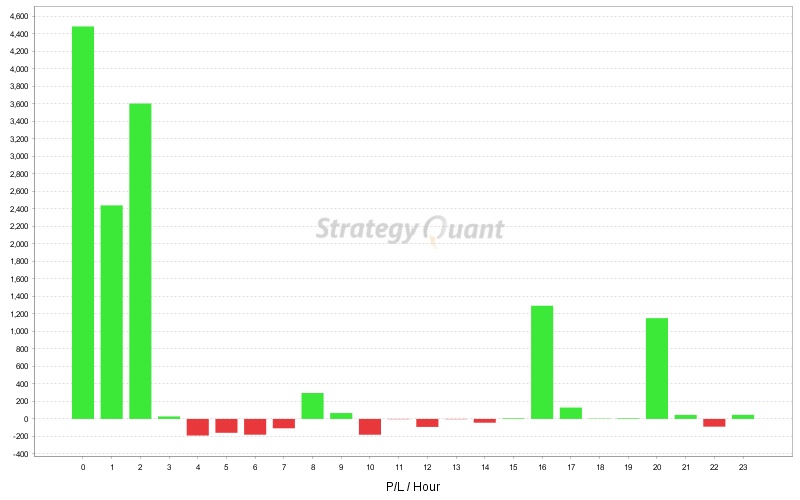
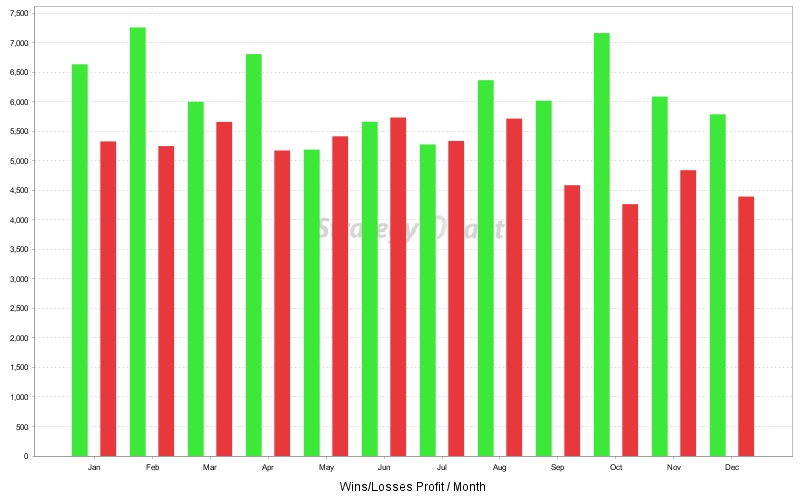
Charts
Click on the chart to see bigger image